Screen status
Click Reports > Screen status for an overview of the statuses of all your devices, laid out in an easy-to-view grid.
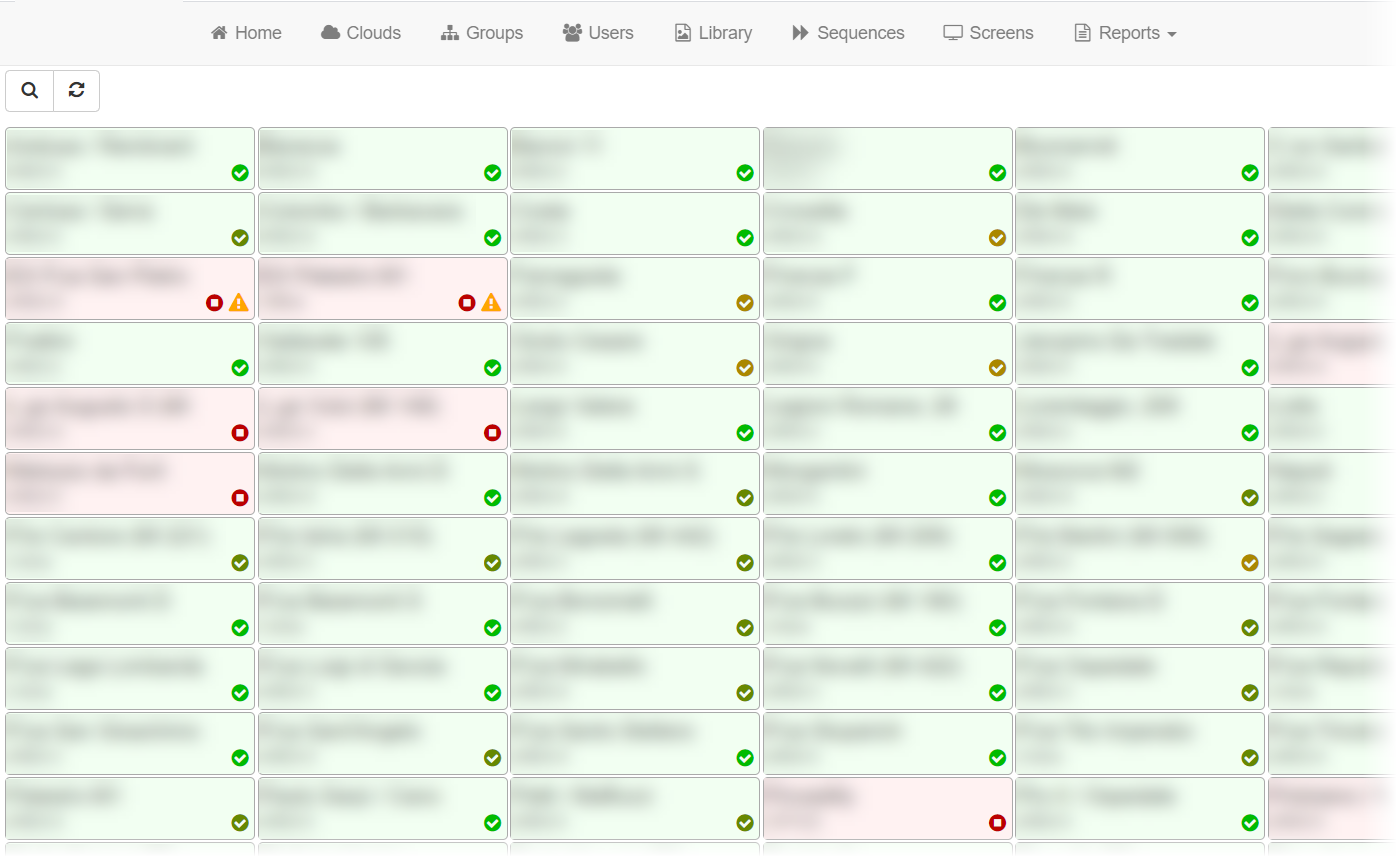
Click the Search button ( ) to find a specific device or group of devices.
Click on a screen to display a pop-up menu with options for editing the screen item and viewing more detailed information about its history and configuration.
- Edit — Click to display the Screen dialog.
- Preview — Click to preview the sequence currently configured to play on the device. The preview opens in a new tab.
- Item map — Click to view an item map for the sequence configured to play on the device. An item map is a visualisation designed to illustrate how sequences and stacks map to displayable items.
- Simulate — Click to open the Reports > Playback simulator page. The simulator provides a list of items that will display based on the current configuration. By customising the date/time, location and other data the simulator can predict what will be displaying in the future.
- Media RSS — Click to view the current sequence in Media RSS format. The Media RSS address can be used to link the sequence to other players and web pages.
- Restart app — Click to restart DS Loader. This will close down the active player software and re-launch it. This can be useful to force a refresh and potentially recover from failures.
- Send log — If you are experiencing problems with a screen, click this option to send a log back to the servers. This log can then be viewed in the web browser to find faults.
- Clone configuration — Click to create a copy of current screen data and apply to another screen by MAC address.
- Remove — Click to revoke your user access from the device. This does not remove the device from the system. The device will remain visible if it is a member of a group you also have access to.
- Screen status history — Click to open the Reports > Screen status history report. This will display the historical status of the screen. Use this report to identity communication failures and data downloaded in different time blocks.
- Display summary — Click to open the Reports > Display summary report to view summary counts of items displayed on the screen.
- Display report — Click to open the Reports > Display report to view a list of what the screen has displayed.
- Collected data — Click to open the Reports > Collected data report.
- Item history — Click to open the Reports > User action report. This report lists the users that have modified the configuration of this screen.
The icons in the corner of a screen item block provide a quick overview of the status. Hover the cursor over an icon for further information about its meaning. Click an icon on a screen to open the Reports > Screen status history tab, where you can find more detailed information.
Screen status history
Click Reports > Screen status history to view the number of screens online during selected blocks of time, and the amount of data transferred during the selected time period. Select the timeframe you want to view from the dropdown menu.
 | Click to display the search field and two dropdown menus which enable you to control which items are included in the status history report.In the top dropdown menu, you can select a specific group to restrict the chart to displaying only the status of screens associated with that group.In the bottom dropdown menu, you can select which columns to display in the list below the chart. |
 | Click to refresh the tab. |
 | Click to filter the displayed items by specific values. |
 | Click to download a CSV file. |
Screen locations
Click Reports > Screen locations to view the location of all devices on Google Maps. This view clusters all nearby screens based on the zoom level of the map. All accessible screens are shown including screens that have been offline for a prolonged period.
Numbered markers show how many screens are within close proximity on the map (typically the same building).
Note: A screen location can be set in the location tab when editing a screen. Please note, this value is pre-initialised based on either the exact known location (if GPS available and enabled) or based on the IP address. Location based on IP address is only approximate.
User and group summary
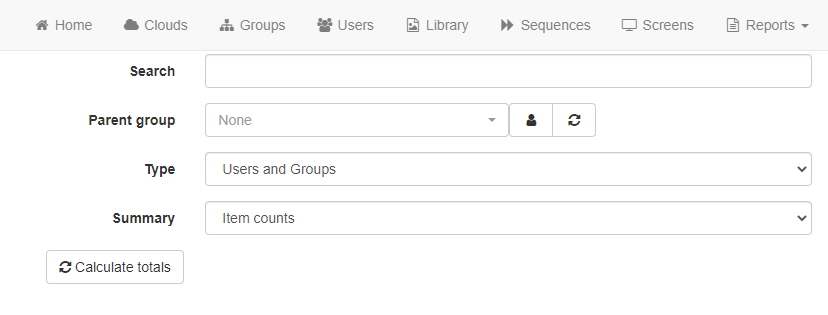
Click Reports > User and group summary to view a summary of users and groups including counts of accessible items and storage used. This report is built using the configured access controls and will show duplicates where items are shared between users and groups.
User action report
On the Reports > User action report tab, view a report of all user actions for a specified time frame.
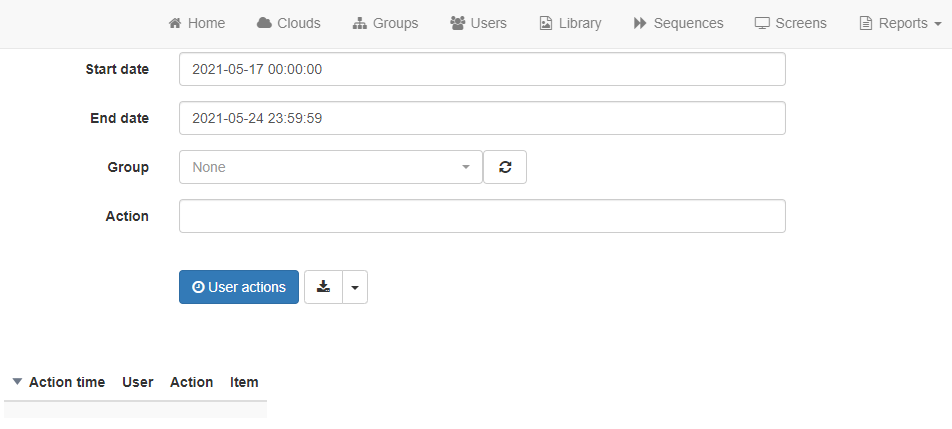
All actions performed in the administration interface create user action records. The records form a comprehensive audit trail listing the changes made to screens, sequences, users, and other items. It also includes failed sign in attempts and other important information. A user action record contains the following data:
- Action time
- User
- Action description
- Object type
Display summary
Click Reports > Display summary to view a summary of playback data. To collect data for display summaries, an item in a sequence must have the Collect playback data option enabled. When the item is displayed on a screen, a display report record is created. A display report record contains the following data:
- Display time
- Item ID
- Screen ID
Additional data associated with items and screens can be combined with display records when reports are generated.
Display report
To collect data for display reports, an item in a sequence must have the Collect playback data option enabled. When the item is displayed on a screen a display report record is created. A display report record contains the following data:
- Display time
- Item ID
- Screen ID
Adding the option collectGps=true into the screen data will instruct the player to also collect the current GPS location and store with each display record.
Additional data associated with items and screens can be combined with display records when reports are generated.
Collected data report
Click Reports > Collected data report to display the Collected data report tab. Use the options to generate a report of additional data that has been collected.
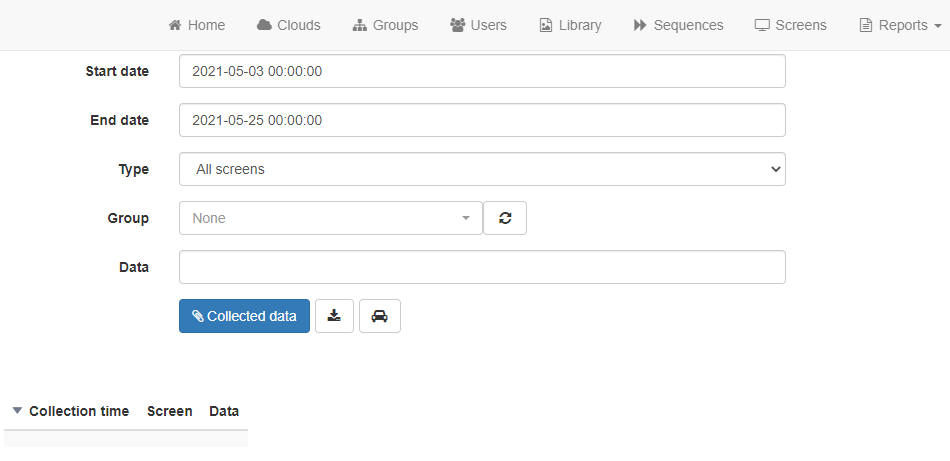
To collect additional data, an event can be created that, for example, allows a viewer to touch an advert and register interest for a product. Data collected can include email addresses, phone numbers, and other text data. A collected data record contains the following data:
- Collection time
- Item ID
- Screen ID
- Data collected
When a user is allowed to interact with a web page, each new web address visited will also be added to the collected data. Scanned barcodes and NFC tags will also be added to the collected data.
Note: The collected data for each record is limited to 100 characters. If a web address or other data exceeds this length only the first 100 characters will be available.
Media upload report
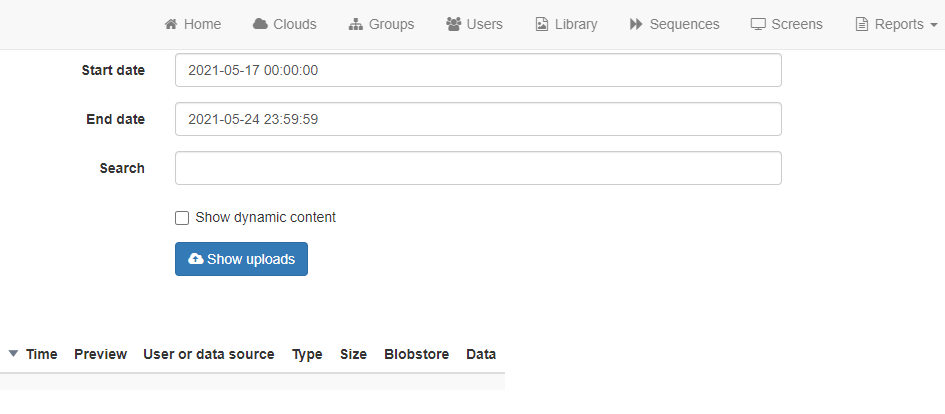
Click Reports > Media upload report to display the Media upload report tab. Use the options to generate a report of all media uploaded to your devices during a specified time period.
